Installation
sudo apt install dddHow to use
Start
ddd <filename>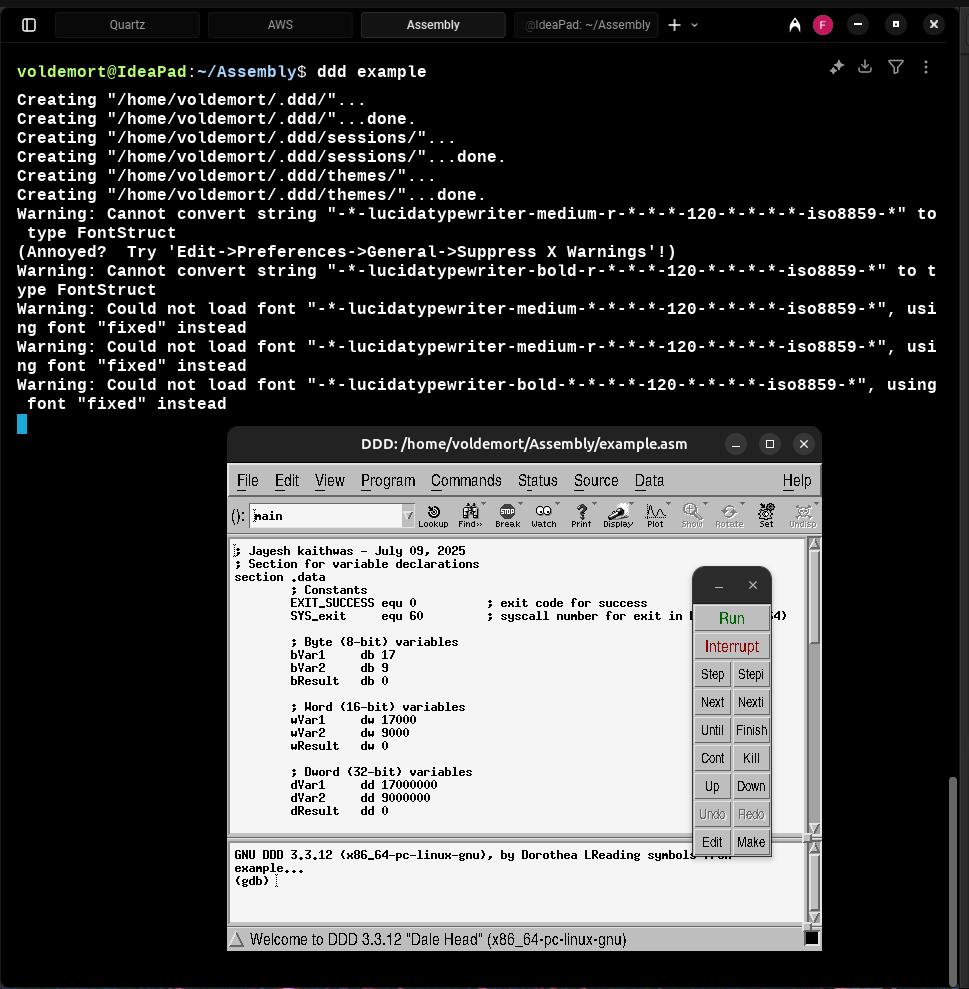
- The
-gqualifier must be included in both the assemble and link steps for file to open it in ddd without error.
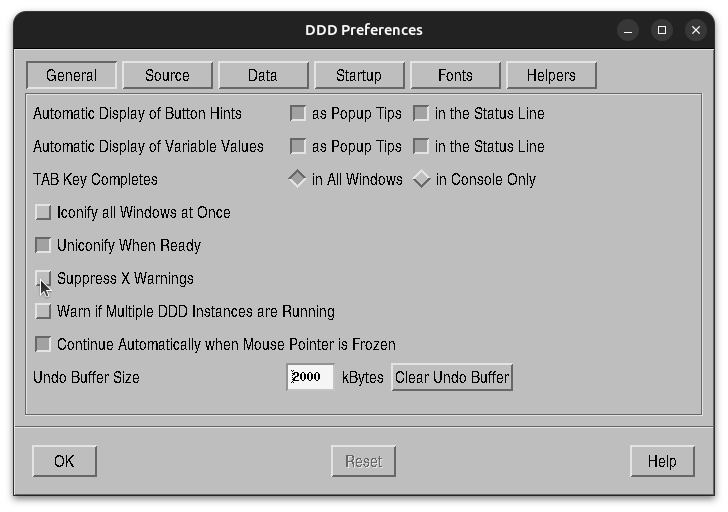
DDD Configuration Settings
- Edit → Preferences → General → Suppress X Warning
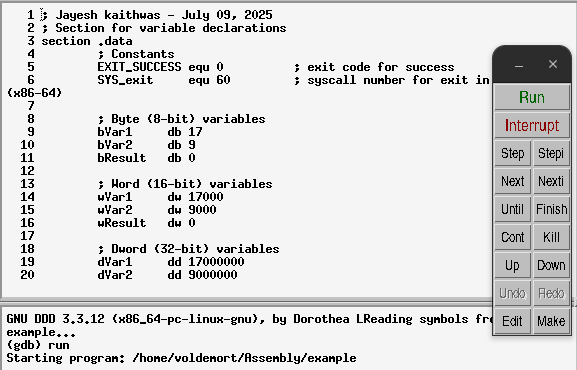
- Edit → Preferences → Source → Display Source Line Numbers
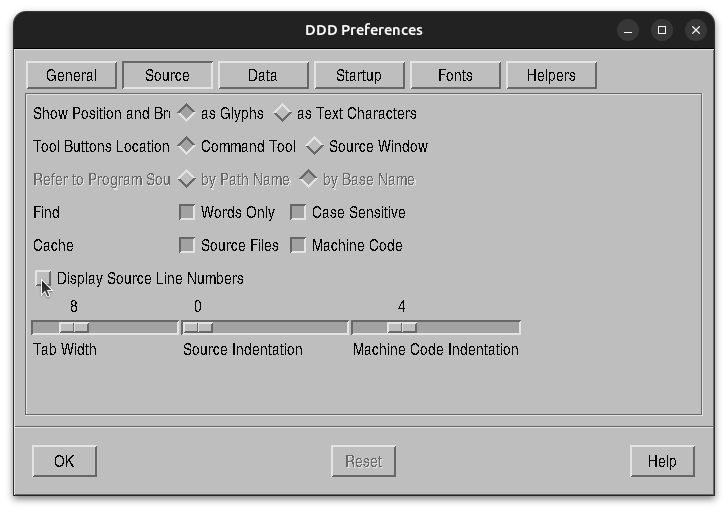
This settings are not compulsory, but it can make the debugging easy.
Program Execution
To execute the program, click on the Run button from the command tool menu or you can type run at the (gdb) prompt (bottom GDB console window)
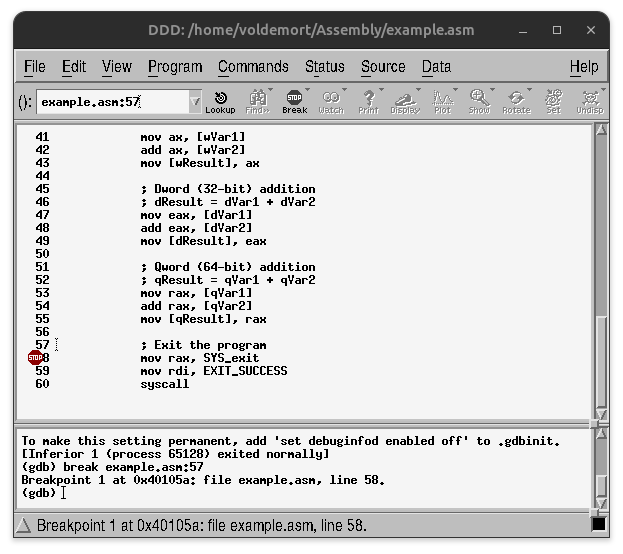
Setting Breakpoints
The breakpoint can be done in three different ways:
- Right click on the line number and select: Set Breakpoint
- In the GDB Command Console, at the (gdb) prompt, type:
break last - In the GDB Command Console, at the (gdb) prompt, type:
break <linenumber>eg. break 57
If a breakpoint is set on line 57, it will stop at the next executable instruction (at line 58).
When set correctly, the “stop” icon will appear to the left of line number.
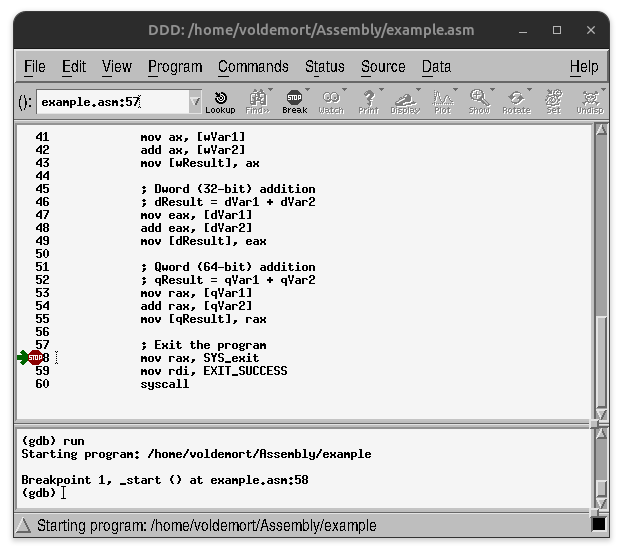
Executing
Once the debugger is started, in order to effectively use the debugger, an initial
breakpoint must be set.
Once the breakpoint is set, the run command can be performed via clicking Run menu
window or typing run at the (gdb) prompt. The program will execute up to, but not
including the statement with the green arrow.
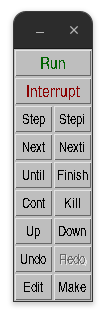
Run/Continue/Next/Step
However, click the Run command will re-start execution from the beginning and stop at the initial breakpoint.
- After the initial Run command, to continue to the next breakpoint, the continue command must be used (by clicking Cont menu window or typing
contat the (gdb) prompt). - The next command will execute to the next instruction.This includes executing an entire function if necessary. The step command will execute one step, stepping into functions if necessary. For a single, non-function instruction, there is no difference between the next and step commands.
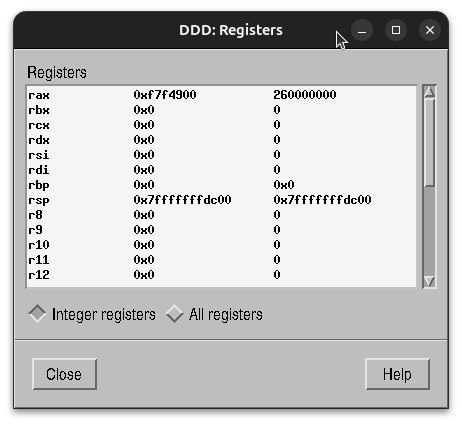
Register Content
- Status → Registers
Commands
| Command | Description |
|---|---|
quit / q | Quit the debugger. |
break <label/addr> / b <label/addr> | Set a breakpoint at <label> or <address>. |
run <args> / r <args> | Execute the program (up to the first breakpoint). |
continue / c | Continue execution to the next breakpoint. |
continue <n> / c <n> | Continue execution, skipping n-1 crossings of the breakpoint. Useful for jumping to the nth iteration of a loop. |
step / s | Step into the next instruction, including into function/procedure calls. |
next / n | Step over the next instruction (skips over function/procedure calls). |
F3 | Restart the program and stop at the first breakpoint. |
where | Show the current activation record (call depth / stack trace). |
x/<n><f><u> $rsp | Examine the contents of the stack at the current stack pointer. |
x/<n><f><u> &<variable> | Examine memory at <variable>. |
- <n>: number of locations to display (default: 1) | |
- <f>: display format (d=decimal, x=hex, u=unsigned, c=char, s=string, f=float) | |
- <u>: unit size (b=byte, h=halfword, w=word, g=giant) | |
source <filename> | Read GDB commands from a file. |
set logging file <filename> | Set the logging output file (default is gdb.txt). |
set logging on | Enable logging to the specified file. |
set logging off | Disable logging. |
set logging overwrite | When logging is enabled, overwrite any existing log file instead of appending. |