Procmon, is an advanced monitoring tool for Windows that helps track registry, file system, network, process, and thread activities. It enhances the functionality of two legacy tools: FileMon and RegMon. Procmon is widely used in malware analysis and system troubleshooting, providing deep insights into system behavior.
Note
Procmon captures a lot of data, it doesn’t capture everything.
For example, it can miss the device driver activity of a user-mode component talking to a rootkit via device I/O controls, as well as certain GUI calls.
Running Procmon Safely
Procmon begins capturing system calls immediately upon execution. Given that a Windows machine can generate over 50,000 events per minute, excessive logging can crash a virtual machine by consuming all available RAM. To prevent this:
-
Run Procmon for limited time periods.
-
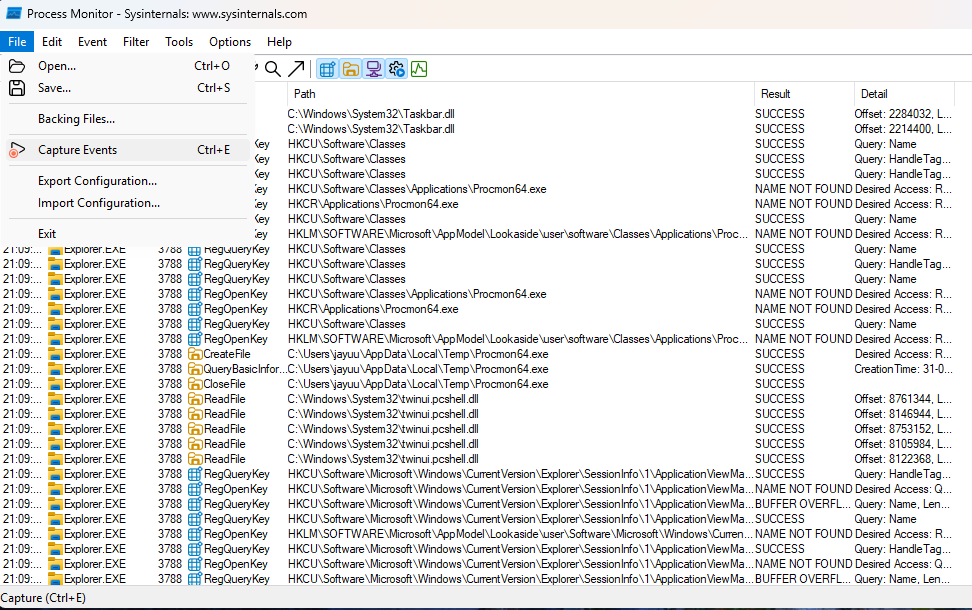
Stop capturing events manually via File > Capture Events.
-
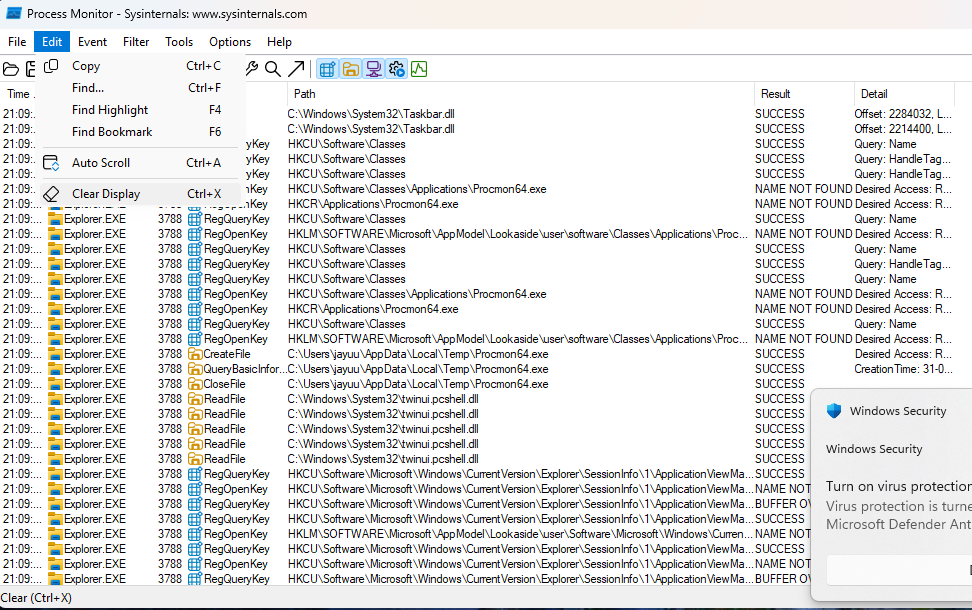
Clear irrelevant data before analysis using Edit > Clear Display.
Understanding the Procmon Display
Procmon provides detailed event logs with configurable columns displaying:
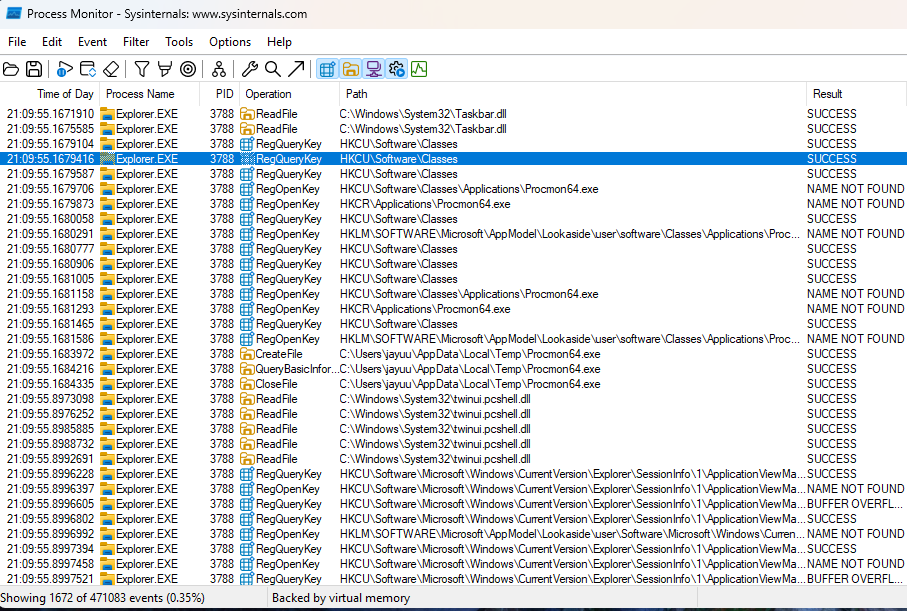
-
Timestamp
-
Process name
-
PID
-
Operation performed
-
Path accessed
-
Result status
For example, a malware sample might create a suspicious file at C:\Documents and Settings\All Users\Application Data\mw2mmgr.txt using the CreateFile operation. The Result column will indicate whether the operation was successful or not.
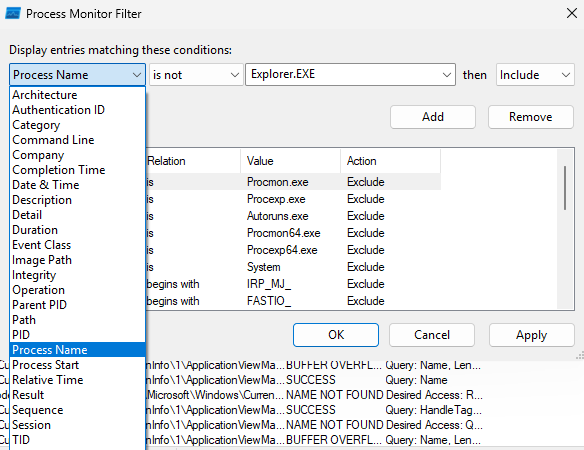
How to Apply Filters
-
Go to Filter > Filter.
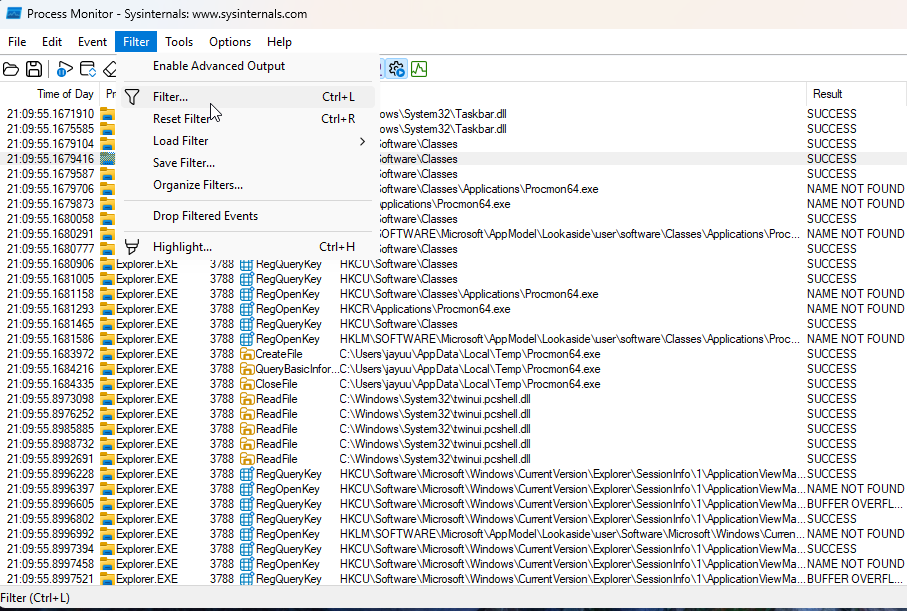
-
Select a column to filter (e.g., Process Name).
-
Choose a condition
-
Click Add and Apply.
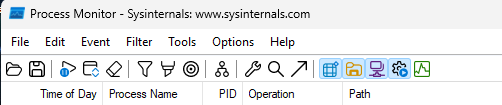
Toolbar Quick Filters
Procmon also offers one-click filters for:
-
Registry: Shows registry interactions (e.g., malware modifying startup keys).
-
File System: Displays created or modified files.
-
Process Activity: Tracks new processes spawned by malware.
-
Network: Identifies network connections (e.g., malware communication channels).